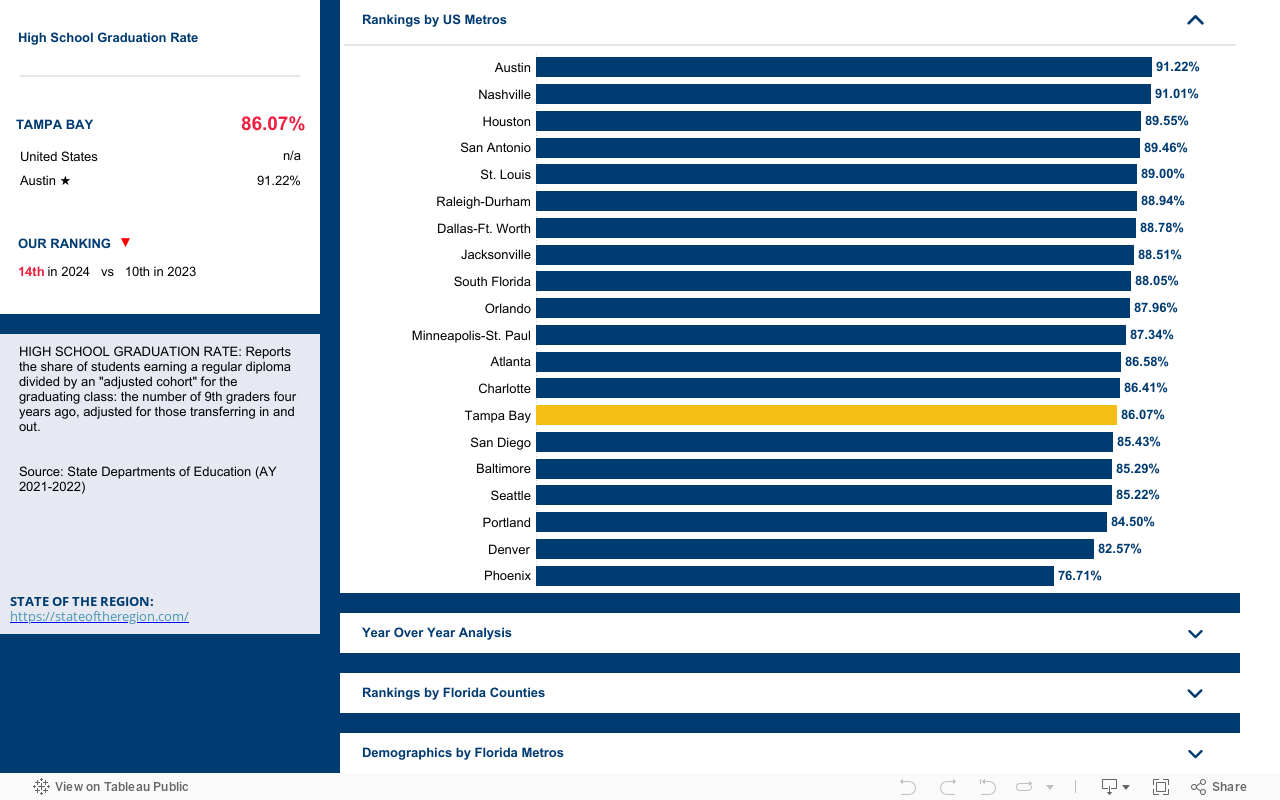
Skip to content
Talent

Talent measures who is working today, and how well the region’s talent pipeline is being prepared for the jobs of tomorrow.

Best Practices & Deeper Dives

How to Read the Tiles How to Read the Tiles

Subject Specific Course Assessment

The assessments below measure students' education gains and progress in various Math and Science courses. Understanding student proficiencies in these areas offer insights into the future STEM and overarching talent pipeline.

Florida Talent Indicators: Science Fifth and Eighth Grade
Florida Talent Indicators: Math Third and Eighth Grades
Florida Talent Indicators: Biology 1 EOC (Score of 3 or better)
Florida Talent Indicators: Algebra 1 EOC (Score of 3 or better)

2024 Takeaways

Tampa Bay’s annual performance in the share of students who passed the Biology 1 EOC assessment improved from 59.97% in the 2023 report to 60.12%, yet we are still below the Florida average (62.59%) and remain in 4th place among Florida metros.

The region performs above the state average in pass rates for Algebra I EOC at 54.59%, and is just narrowly behind South Florida (54.92%). Jacksonville has over a 10 percentage point lead in this indicator.

Tampa Bay ranks in 4th place on the 3rd and 8th grade Math assessment, with 55.95% of students earning a passing score. The region trails behind the state average in Science for 5th and 8th grades at 45.97%.

INCREASING VALUES

Content mastery and passage of the relevant exams allows for progression through the education “pipeline.”

DECREASING VALUES

Failure to meet these standards may preclude student advancement, from one grade to the next, from secondary school to an institution of higher education, and from school into a job with family-sustaining wages.

CONTRIBUTING FACTORS

  • Parents’ Educational Level
  • Socio-Economic Status
  • Teacher Competencies
  • Instructional Strategies and Methods
  • Class Size
  • School Funding / Resources
  • Access to Tutors