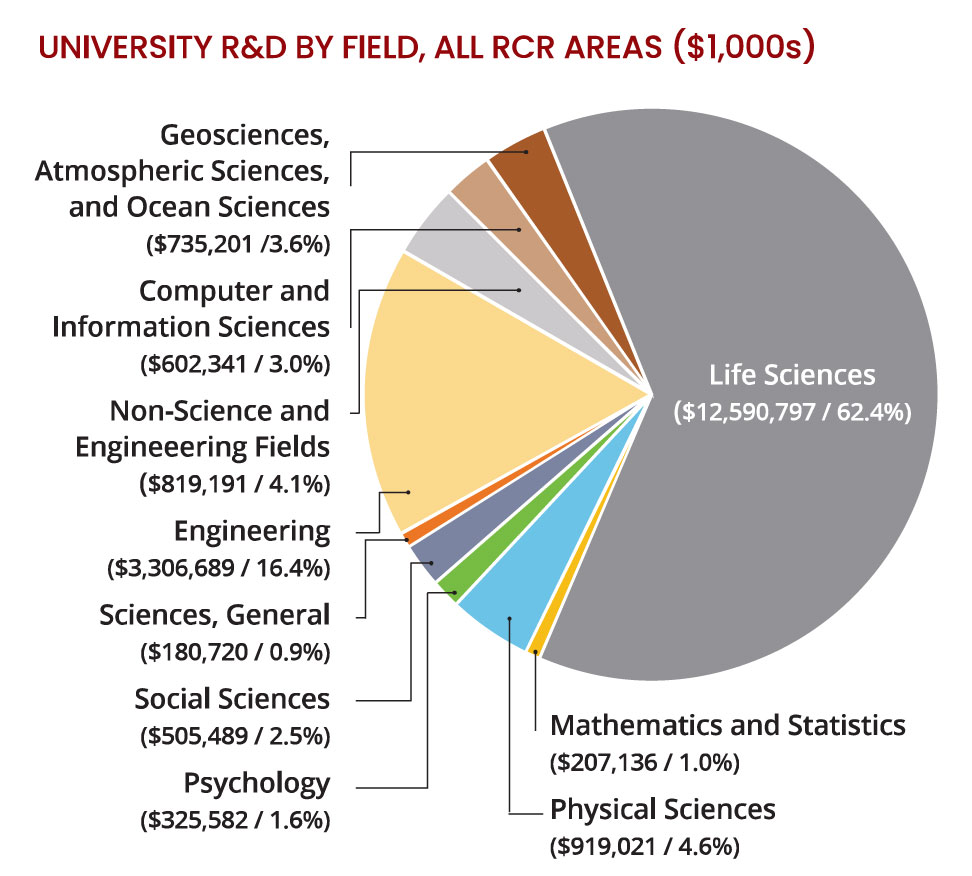
Tampa Bay’s University R&D portfolio is diverse- all fields saw some sort of expenditure in FY2017. Life Sciences at 62% of the regional track tracks the RCR cohort well. Key divergences, measured by the regional share of research dollars allocated for each field, divided by the average share for the comparison regions, include Social Sciences (7.0%: 2.5%, 279% of average) and Non-Science and Engineering Fields (11.1%: 4.1%, 275% of average).
Conversely, Tampa Bay conducts significantly less R&D relative to the aggregate portfolio in Computer and Information Sciences (1.3%: 3%) Mathematics and Statistics (0.4%: 1.1%) in Sciences, General (0.4%: 0.9%) each 43% of the average. At $46.7M, Engineering, 16.4% and the typical region’s R&D portfolio, accounts for half as much 8.2% of Tampa Bay’s R&D expenditures. These fields have a great opportunity for spinning off high wage companies and developing technology commanding high license fees, each of which contributes to regional prosperity.


